Send effective emails

Reading emails is too often perceived as a chore. Yet, sometimes you receive the perfect email—I don’t mean the one saying you won to the lottery and must send 50€ to receive your prize. You feel this email is effective and directly actionnable.

The main problem with emails is their daily amount (300 billions a day—really?!). You already know the reasons: either we use emails as a chat software, or we don’t understand the text, or we desperately try to find a free slot for a meeting, or we forget to attach the file, or… or … The list is long.

Before you send, stop!

An easy solution to many of these problems: wait before sending your email. Take some extra time to read it, correct the typos, check if you attached the files you promised, and see if something could be misunderstood. It feels too simple, but how many times did you click on the button without reading your email? Someone else will read it, you should make sure he/she will understand it, so start with yourself.

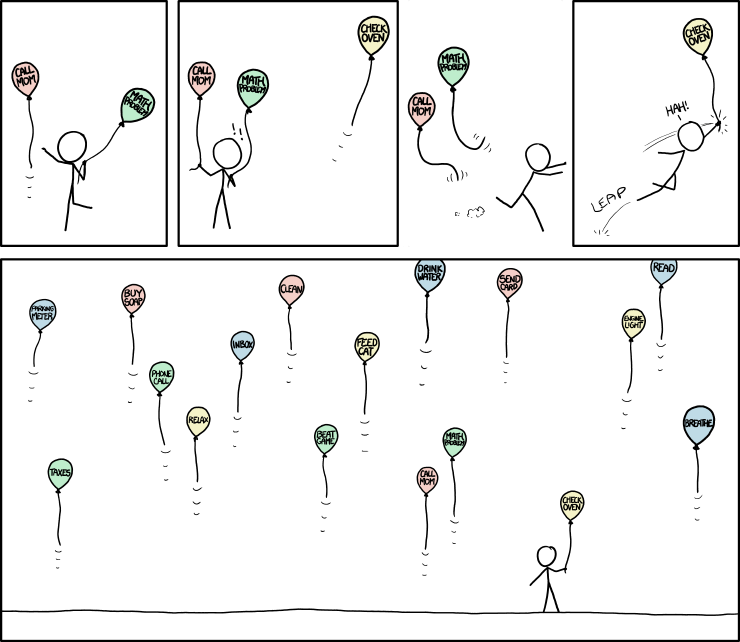
We optimise the wrong objective

We all have this feeling when opening the inbox: the objective is to process as many emails as possible in the shortest time. Unfortunately, that can easily lead to issues. What do you feel when you read the following thread?

You: I think we should meet to discuss my thesis. I have several questions.

Me: Good idea.

(sigh) this will be long…

You: Do you have any availabilities?

Me: Tomorrow morning?

You: Sorry I have classes.

Me: Could you suggest some time slots?

…(5 more emails)…

You: Great thanks for making the time.

Me: No worries! Happy to help. By the way, what are the questions?

You: It is about model Y and Z.

Me: Mmmh. We’ll need John to be there during the meeting. He developed them. @John: are you available?

John: Sorry! No.

This can easily take some time. We have maximised our objective—the amount of emails processed—but it is the wrong one.

Minimise the overall number

In his book Deep Work (and also in this blog post), Cal Newport, change the objective: instead of maximising the number of processed emails, you should minimise the number of emails needed to achieve your goal. Believe it or not, every email you send has a goal. Identify it upfront and find out how you could minimise the exchange of emails. Remember: you have no control on the receiving end so make it robust.

For example, here are advices when you want to plan a meeting for discussing a question. First, check if the other person is holding office hours—some time slots where he/she guarantees to be present and available. This is perhaps the easiest way to get a rapid answer to your question. If that’s not possible, second, make sure you give three available slots for you and use automatic scheduling system to help you. I like vyte.in but there are many other options. It should be easy for you and the receiver. Once a choice is made, no other action should be needed. Third, make sure to include your questions.

Final thoughts

Keep your message short. Keep removing content until it affects your objective.

Always specify a deadline. If you don’t give a deadline, you might as well be forgotten. It might feel uncomfortable so include the explanation for your deadline and an opening for negotiating it. Don’t forget, minimise the number of emails, it shouldn’t be a long discussion to find the right deadline.

If you are asking for a decision. Include all the information you find necessary, not more. Also make the effort to indicate what you think should be the decision from your perspective. You should aim at a decision in one reply.

Take enough time for each of your email. The return on investment is big!

Working within my group for your MSc thesis

You start your MSc thesis in my group, lucky you, me and my group! I hope every thesis is a win-win situation where the supervising staff (the researchers in my group and me) learn from the student as much as the student learns from us. To create such situation, I think the best way is to have a good organisation. Here are how we will work. These advices comes together with my other post on the 9 laws towards a successful MSc thesis.

Most if not all MSc thesis will be performed within the current research topics of my group. Of course, we sometimes want to explore new ideas and some theses will be on the fringe of these topics. Nonetheless, every student will have a mentor—a PhD student supporting them. This will be their first contact person to help them and will ensure a quick feedback.

In practice, I want regular meetings organised between the students and their mentor. Once every week (at least), the students should send an update and organise a meeting with their mentor. Similarly to being agile in projects, these meetings should help moving things forward throughout the year. Once every month, the student will also organise a professional meeting including me. The purpose there is to train you on three things: prepare such a meeting with an agenda, present your latest findings, and write documents. The last two are particularly important as you will have to defend your thesis and write a manuscript. Starting early with both is key to success.

I understand your learning programme won’t allow you to have the same intensity all the time. You might also be abroad with many courses to attend. But I insist, the best thing for you is to work on your thesis regularly and during the full year. We see a strong difference in maturity and quality when the student works earlier on the thesis. Moreover, the supervising staff has much more opportunities to give feedback. We are frustrated not to give you more inputs when everyone sends something at the end of the academic year. You will be frustrated too and your score will definitely be affected.

Fat outline: put some meat on the backbone of your research

You want to convey your next idea to the world—or your supervisor—but you are lost on the most effective way. Very often, you would fall back to sending a rough table of content—the backbone of your research. Unfortunately, this backbone does not completely convey the motivation of the research, the logic you follow, and is very hard to get direct feedback on. There is an alternative: adding meat on the backbone and producing a fat outline.

Suggested by Josh Bernoff, the fat outline is like the ongoing draft of your paper. It contains (of course) how you will organise the content but also pieces of the actual text, doodles of the graphs you expect to get, keywords, and basically anything you want—or should receive—feedback on. It forces you to think hard on how you motivate your work. You can then more easily convey this motivation to others. And others can also tell you where you are going wrong.

Use the fat outline as the platform to quickly iterate your ideas in the early phase of your paper. You’ll hit two birds with one stone: you check your idea at minimal cost, and you already build momentum towards your next paper.

Does ‘stacking’ work for displaying trends? Our vision on how to plot typical energy data.

BP launched on the 11th of June their 2019 Statistical Energy Review. The data published every year as part of this review is very valuable for anyone working in the energy sector, with detailed information about world energy consumption (and production), CO2 emissions by source, per geographical area, per country, etc. Along with this information, BP releases a report, where the data is visualised through different graphical displays. Looking at the 2018 edition, we have seen that they use a very typical graph to report energy trends: the stacked area display, which is also used by other very well known institutions like the International Energy Agency (IEA). Nevertheless, staked area graphs –actually stacked graphs in general– are quite ineffective. Let’s explore why.

We will discuss the particular graph below, which shows the World energy consumption by source, from 1992 until 2017. Each source is represented by an area, and each are is stacked one on top of each other until reaching the total consumption.

What are the main problems of such a graph? Namely:

  • A colourblind person will not be able to read it.
  • It’s very complicated to ‘isolate’ the evolution of one particular energy source.
  • Specific events for a certain energy source cannot be distinguished.

The colours and design are not suited for a colourblind person

The display uses a legend to identify the energy sources, which forces reading the graph in two steps. Furthermore, the chosen palette of colours is unfortunate for a colourblind person. Here’s how a protanope (red-color blind) would see it:

Oil (originally in green), nuclear (originally in orange) and renewables (originally in light orange) cannot be well distinguished by a person with colour deficiency. As we discussed in this post, colourblindness is much more common than we thing. By using legends and not paying attention to the selected colours, BP’s graph is unreadable for a great part of the population.

The evolution of a specific energy source can’t be easily isolated

Would you be able to say whether nuclear consumption changed in the last years or whether it remain constant? What about hydroelectricity, how much did it increase? How does coal consumption relate to oil consumption? Answering to these questions is quite tricky with a stacked area graph.

We can’t figure out how specific events affected a particular energy source

Let’s take the example of renewables, which come after oil, natural gas, nuclear and hydroelectricity in the stacking. It is obvious that the financial crisis in 2009 influenced energy consumption, but how were renewables in particular affected? Were they actually affected at all? It is impossible to figure this out in the stacked area graph.

What would be an alternative to such a graph?

It all comes down to the message that we want to communicate. Ideally, the caption of a figure should give us a hint. Let’s look at what BP writes in their report:

World primary energy consumption grew by 2.2% in 2017, up from 1.2% in 2016 and the highest since 2013. Growth was below average in Asia Pacific, the Middle East and S. & Cent. America but above average in other regions. All fuels except coal and hydroelectricity grew at above-average rates. Natural gas provided the largest increment to energy consumption at 83 million tonnes of oil equivalent (mtoe), followed by renewable power (69 mtoe) and oil (65 mtoe).

None of these messages can be actually withdrawn from the graph… As an alternative to the stacked area graph, we have produced the displays below in order to unveil the real value of the data.

A line graph that shows the evolution of each energy source

Which clearly shows, among other messages, that:

  • As opposed to oil, coal and natural gas, renewables consumption did not decrease in 2009 due to the financial crisis.
  • Nuclear consumption has remained constant, and even decreased, in the last years.
  • Oil energy consumption is larger than coal; however, not as much as in the nineties since coal consumption started to substantially grow around 2002.

Small multiples to display and highlight the growth of each energy source

In order to display the growth rates of total world energy consumption and of consumption per energy source, we have utilised small multiples. The same plot is repeated seven times, each one of them highlighting one line. Total consumption is placed first; then, each energy source appears in descending order according to the growth rate in the last year. From this graph, it is clear that renewables are growing at substantially higher rates than the rest of energy sources. Although fossil fuels appear like increasing fast in the previous graph, their growth rates are not as high.

A line graph to compare energy consumption by geographical area

This line graph highlights the impressive growth on energy consumption in Asia Pacific since 2000, probably due to industrialisation in China. Its consumption almost doubles the one in North America. On the other hand, Europe has remained constant at around 2000 mote for the last 25 years.

A bar chart comparing growth per region in the last year

A bar chart allows quickly comparing different categories of one variable. If plotted horizontally, we have enough space for writing down the categories without having to tilt them. Moreover, we’ve shown them in ascending order so that it’s immediately evident which region grew the most, which the least and which ones were below or above average.

When producing this graph, we actually realised an error in BP’s report. They write that “Growth was below average in Asia Pacific, the Middle East and S. & Cent. America but above average in other regions”; however, Asia Pacific, the Middle East, Africa and Europe grew all at above average rates.

Our take-away lesson: focus on the messages, don’t follow the default.

BP’s data is so rich that has allowed us to produce four different graphs (and we could go on plotting), all transmitting a different key message. By using the ‘default’ stacked area graph, so often seen in the energy scene, BP ended up making a mistake when reporting the growth by area. As we highlight in our graph training, our take-away lesson is: plot the data, focus on the message (adapt the graph to it) and never trust the defaults.

Reporting election results in an effective way

Last 26th of May European elections took place. In Belgium, people also voted for the 150 deputies who are part of the Chamber of Representatives as part of the federal elections. The following day, newspapers, webpages and television news were flooded with graphs showing the results. But are these graphs effective in transmitting the key messages?

How the press reported the results

Let’s take an example. The graph below is extracted from the Belgian newspaper Le Soir and it is similar to the ones that La Libre Belgique and L’Echo reported. It shows the distribution of seats in the parliament, comparing the results between 2014 and 2019.

Results of Federal Belgian elections as reported by Le Soir here.

We believe that this is an ineffective way of reporting and contrasting election results for several reasons. The main problem is the difficulty to get the main messages after a first glance. The results of 2014 are shown in a light blue bar which does not work well when there has been an increase in votes. To get the numbers of 2014 we need to look at the number of seats in 2019 and reduce (if we get a green arrow facing upwards) or increase (if the arrow is red and downwards) the grey number.

In this bar chart it is almost impossible to appreciate (unless we look at it for a while) that the far-left PTB*PVDA party had 0 representatives in 2014 but 12 in 2019. Or that the extremists Vlaams Belang increased from 3 seats in 2014 to 18 seats in 2019. The green parties (Ecolo and Green) are separated by several bars, so we can’t directly appreciate that there’s been a green wave. In essence, bar charts like this one require quite a lot of time to understand and draw conclusions

What would be an effective alternative?

We’ve re-worked the graph of Le Soir into what Edward Tufte calls a table-graphic. The chart, when read vertically, ranks the 13 parties by number of seats in the parliament in 2014 and 2019. The names of the parties are spaced in proportion to the number of seats. Across the two columns, the paired comparisons show how the numbers have changed over the two election years. The slopes are also compared by reading down the collection of lines, and lines of unusual slope stand out from the overall downward pattern.

In this re-worked graph, the messages clearly stand out (as opposed to the bar chart):

  1. All parties, except four, have lost seats in the parliament.
  2. N-VA has lost its privileged position, going down from 33 to 25 seats.
  3. The far-left PTB*PVDA, which had no representation in 2014, has entered the parliament in 2019 with a total of 12 seats.
  4. The support to the Greens (Ecolo and Groen) has raised from 12 to 21 seats.
  5. The right extremists Vlaams Belang have also substantially increased: from 3 seats in 2014 to 18 in 2019.

Interested in data visualisation?

If you’d like to know more about how to get the most out of your data and produce graphs that effectively visualise your messages join our training: Figures of evidence: uncover the real value of your data by making effective graphs. We are offering an independently organised version of this training on the 28th of June in Brussels, register here, there are still places available!

Ready to try Agile for research?
Join our upcoming study

A PhD (or any research project) can feel at times as long and tiring as running a marathon. Yet, as we explained in this post, there are techniques you can use to alleviate the pain and turn your project into a series of dynamic sprints.

Laura Pirro, PhD candidate at Ghent University, realised the potential that Agile project management could have in academia. Agile has revolutionised the software-development sector and it is now used in many other areas (from manufacturing industry to the FBI). Why not using Agile for academic research too? In many aspects, academia is different than industry but Agile philosophy can still be applicable. Laura has worked on adapting Agile to research: you can find the details of the methodology she proposes in this post that she wrote for Nature Careers.

Agile for research has already proven success in Joris Thybaut’s research group at Ghent University (where Laura is pursuing her PhD). We are now looking for enthusiastic researchers and professors who would be happy to test Agile for research during a few months and let us know their results.

How could Agile for research work for you?

If you are a student

As a student, you probably understand that your advisors/supervisors are incredibly busy people with tight timetables. Still, you work hard on your project, and you often need advice on how to proceed with your research. However, setting up a meeting with your supervisor whenever you encounter an issue may feel like a struggle: it sometimes takes so long that by the time you get to meet her/him, you have already figured a way around the problem (although sometimes it might not be the ‘right’ path, so you need to go back and redo some stuff).

Agile for research will allow you to have continuous feedback on your activities in an effective way both for you and your supervisor. First, it will ‘force’ you to organise sprint planning meetings with all the stakeholders involved in your project: supervisor, postdoc, industrial partner. master student… in order to get everyone to agree on the goal and the duration fo the sprint. Thereafter, you will have short (15min) scrums every week with your supervisor so as to answer three questions: what was done the previous week to contribute to the goal? What will be done next week to contribute to the goal? And, are there any impediments? Finally, once the sprint is finished, you will meet again all the stakeholders for the sprint review, retrospective and planning.

If you are a professor/supervisor/student advisor

Following the work of students can be incredibly time consuming and difficult to fit in in your timetable. Furthermore, it is frustrating to dedicate time to students who (sometimes) still seem lost and have an unclear idea of what exactly they should do in their project. These tasks get even harder as the number of supervised students increases.

Agile for research will allow you to structure the way you communicate with your students. In a collaborative effort, the project is divided into layers of activities with an estimated duration of 2-12 weeks. In the sprint planning meeting, the specific goal and duration of the activity is decided with all the stakeholders (student, industrial partner, postdoc, etc.). Thereafter, you will follow the work of your students with short weekly scrums of only 15 minutes. Finally, in the sprint review, retrospective and planning all the stakeholders come back together to remove impediments, adapt to changes and plan the next sprint.

Does this sound appealing? Get in touch with us!

If you believe that Agile for research might be interesting for you, please get in touch with us or with Laura Pirro! We are conducting a study to see how this methodology fits in academia and we would be happy to solve any questions and provide additional information. We look forward to hearing from you!

Anthropomorphism or the art
of humanising nonhuman subjects

Academic writing should be clear and objective. In the pursue of objectivity, some believe that by using the first person and introducing ‘I’ or ‘we’ in their text, the outcome will not sound as rigorous or formal. But attempting to avoid the first person may confuse readers, leaving them wondering ‘who does what?’ as we discussed in our article about the passive voice. Focusing on objectivity may also lead to anthropomorphism.

Continue reading “Anthropomorphism or the art
of humanising nonhuman subjects”

Passive voice in scientific writing: angel or devil?

For years, we were told that in scientific writing we needed to use passive voice to sound formal, neutral and serious. More recently, the contrary philosophy bursted in: suddenly, passive voice had to be by all means avoided as it forces hiding the agent of the sentence and creates confusion. This paradigm shift left many of us in the doubt… is using passive voice in formal, scientific writing right or wrong?

Continue reading “Passive voice in scientific writing: angel or devil?”

What if your PhD didn’t need to feel as long and tiring as a marathon?

In many ways, pursuing a PhD resembles running a marathon: long distance, loneliness and fatigue are seemingly insurmountable obstacles and nobody can hope to reach the end without adequate training. [Actually, according to ancient literature and mythology, one non-professional athlete ran the first Marathon in full armor in the Greek August weather (Lucas, 1976), but he paid the effort with his life! This certainly does not set a positive example for all of us, aspiring PhD holders…].

Continue reading “What if your PhD didn’t need to feel as long and tiring as a marathon?”

Not in the mood to write? Why you should still show up, even if the muse doesn’t

Let’s face it, us, scientists, are passionate about our job. We are usually delighted about carrying out our scientific tasks (experiments, simulations, reviews, etc.). But when it comes to writing our findings, the motivation goes down. We rarely feel we’re ready to write and we rarely feel in the mood to write… the consequence: when we sit down and are supposed to write, we rather start doing other things, we procrastinate. And of course procrastination comes guilt and frustration. Until the deadline dangerously approaches: then, in the last minute, creativity pops up. Well, let us break it for you: that’s not really last minute creativity, that’s stress and adrenaline doing their job.

In our Road to Bootcamp series of posts, we’ve already covered how starting writing your work early enough will let you fully benefit from the ‘magic’ of the writing process; therefore, reducing procrastination. In this post, we’ll focus on how creativity can be boosted—even when you’re convinced that you’re not in the mood to write.

Continue reading “Not in the mood to write? Why you should still show up, even if the muse doesn’t”

Want to procrastinate less and be an effective writer? Start writing your articles early enough

If you ask researchers about their main issues when it comes to writing, procrastination always appears on top of the list. There are several methods that can help you become an effective writer who seldom procrastinates (or who effectively procrastinates—did you know that that’s possible?), so on our Road to the Writing Bootcamp we will be dedicating a series of blog posts to this problem. 

Why do we procrastinate when it comes to writing a scientific document? For multiple reasons, but many of them are related to the fear of the blank page, also known as writer’s block.

Continue reading “Want to procrastinate less and be an effective writer? Start writing your articles early enough”

Succeeding at your scholarship interview:
Advice from Prof. Alessandro Parente

We had the pleasure of interviewing Alessandro Parente, Professor at the Aero-Thermo-Mechanical Department of the Université Libre de Bruxelles (ULB) and frequent member of juries for the FRIA and FNRS fellowships. He talked with us about his experience as a jury member and he gave us some precious tips for students preparing for this type of scholarships.

Continue reading “Succeeding at your scholarship interview:
Advice from Prof. Alessandro Parente”

Are your documents colourblind friendly?

Did you know that one in twelve Caucasian (8%), one in 20 Asian (5%) and one in 25 African (4%) males are colourblind? For the case of women, the probability goes down to one in 200 (0.5%). Still, this means that there are always colourblind people among the readers and the audience of the reports, papers and presentations that you produce. In academia, assuming that your next journal paper is reviewed by three white males (which is rather likely given the population in science nowadays), the probability that at least one of them is colourblind is 22%.

Continue reading “Are your documents colourblind friendly?”

Is your supervisor your best opponent?

One of my favourite time of the day, aside from having quality time with my family, is when I discuss (read argue) with the PhD students I advise or train.
I am a big fan of feedback, as I believe this is the only way we can learn (aka deliberate practice). So I enjoy being challenged by the researchers as much as I like to challenge them.

This post includes a simple technique to challenge your advisor, it then explains why it is important to do so, and it finishes with how you can apply it to yourself. Continue reading “Is your supervisor your best opponent?”

Effective template to write your answer to reviewers

You have just received the reviews for your article. After a long wait, this is the most painful step. The main issue is that reviewers and authors don’t speak the same language. To speed up and ease this process, authors should address the comments so that reviewers can easily assess how their feedback has been tackled. What is then the most effective way of writing your rebuttal?

Continue reading “Effective template to write your answer to reviewers”

You want to write articles that get accepted? Do reviews.

At the end of my PhD, I started receiving invitation to review articles. At that moment, I felt honoured as if I had received the membership card of a very selective club.
Later, as a postdoc and professor, the number of invitations increased while my time available for such type of tasks decreased. However, I noticed something interesting that I wanted to test with my students.

Continue reading “You want to write articles that get accepted? Do reviews.”

The authorship manifesto

Getting your name on an article is becoming more and more important in the “publish or perish” era. Although I believe writing papers is an excellent objective for doing research, deciding who should be on the paper can become tricky in some cases.

Here is the result of an intense discussion during the team building (with ATM, FLOW and BURN research groups) in 2017. You can directly jump to the summary table at the end if you are in a hurry.

Continue reading “The authorship manifesto”

The evolutionary brainstorming: do it as your brain was wired to do it

  1. You have probably been in many brainstorming meetings where you encountered one of the two following scenarios:
  2. “Dear colleagues, what are your ideas on this project…”, followed by a long silence, as if there was a brainstorming switch to turn on;
  3. You suggest an idea and immediately someone is saying: “No, this is not possible, it’s not a very good idea!”.

These two scenarios gather the two main pitfalls of effective brainstormings: priming and judging. Continue reading “The evolutionary brainstorming: do it as your brain was wired to do it”

Does your article address these important issues?

I often need to review articles and give feedback on them. I find my feedback is most efficient when I can focus on the content (results, figures, etc) and the flow of the article. These aspects of the article are what interest the first author most, even if he or she is also happy to get a review of the typos or other secondary problems. Yet, more often than not, many of my comments are about things that can be more or less automatised. This post is a checklist for the common problems I encounter. Continue reading “Does your article address these important issues?”

Are you lost after the submission of your manuscript?

After submitting your manuscript, the hard wait for the review starts. You could think that everything is handled perfectly on a first-in-first-out basis. But this is unfortunately not the case. It is not an easy job to be an editor, it takes a lot of effort, time investment and organisation. So you have to do everything to facilitate their work and this requires some follow-up from your side. Here are the most important steps. Continue reading “Are you lost after the submission of your manuscript?”